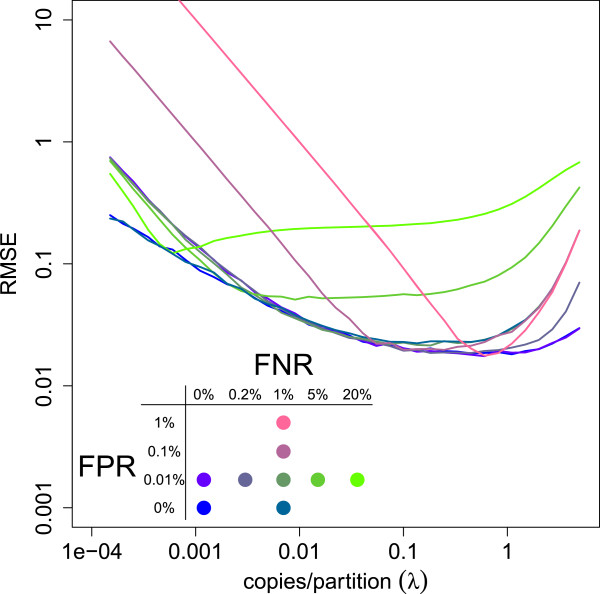
Figure 8.

Relative RMSE of the target concentration estimates under realistic assumptions and misclassification. The  is estimated as the square root of the sum of the relative variance and squared relative bias for S=1000 simulated experiments of 8 replicates. As results are relative to the true concentration λ, the precision of different dilutions of the same sample can be assessed on the same scale. Results were plotted for different misclassification probabilities (FPR, FNR) with FPR = false positive rate = 1-specificity and FNR = false negative rate = 1-sensitivity and in the presence of pipette error and unequal partition size. When misclassification is limited, a relatively wide window of dilution exists in which high accuracy and precision can be achieved.
