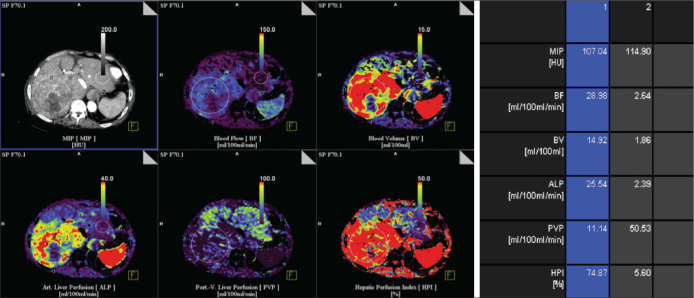
Figure 1.
Transverse contrast material functional CT perfusion color map of BF of CT perfusion in a patient with HCC in right lobe of liver. Various ROIs in tumor (1) and normal liver (2) were drawn Transverse CT perfusion functional maps of BF, BV, ALP, PVP, and HPI in 65-year-old man show large mass in right lobe of liver that has a distinct range of colors compared with background liver parenchyma.

