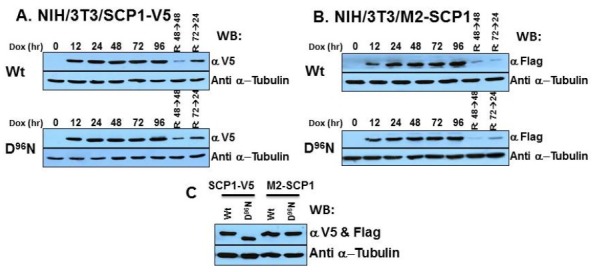
Fig. 2. Establishment of hSCP1-expressing inducible NIH/3T3 cells ((A) NIH/3T3/hSCP1-V5 and (B) NIH/3T3/M2-hSCP1). The expression levels of hSCP1 (Wt and D96N) treated with or without the inducer for the indicated periods of time were monitored by Western blot analyses with the appropriate antibodies. For reverted cells, the cells were treated with the inducer for the indicated periods, and after the replacement with fresh medium, the cells were allowed to grow for the indicated periods of time without the inducer. (C) For the comparison of molecular sizes of hSCP1 (Wt and D96N) from NIH/3T3/hSCP1-V5 and NIH/3T3/M2-hSCP1 cells, equal amounts (30 μg) of total cell lysates from the abovementioned cell lines were analyzed by immunoblotting with a mixture of α-DYKDDDDK and α-V5 antibodies and detected with HRP-conjugated secondary antibodies.

