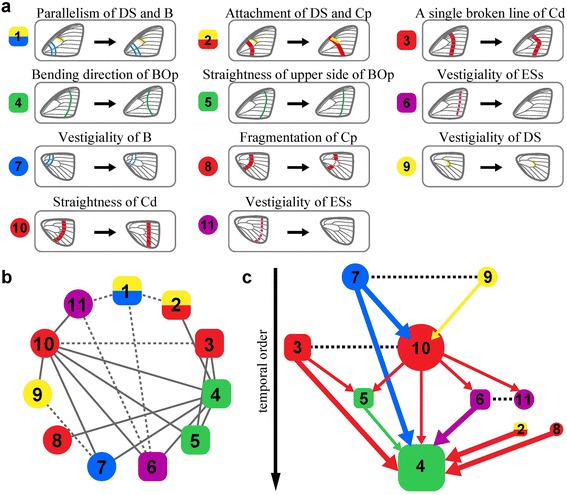
Figure 4.

Bayesian inference of temporal order in character state changes. (a) Evolutionary changes in 11 characters from state ‘0’ to state ‘1’. (b) Evolutionary dependency map: Summary of dependent evolution between character state changes. Mutual dependency is shown by dotted lines, whereas contingent dependency by solid. (c) Evolutionary contingency network: Temporal order of accumulation of character state changes. Line thickness reflects Z-score (thin lines for lower Z-scores (>70%) and thick for higher Z-scores (>90%)). Earlier changes are presented at the top of the network. Mutually dependent evolution is shown by dotted lines (no arrow). Characters in forewings (squares) and hindwings (circles) are coloured as in Figure 1.
