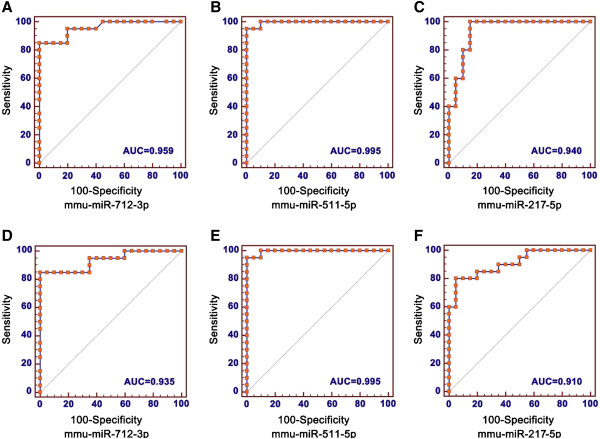
Figure 3.

ROC curve analysis of the expression of plasma levels of mmu-miR-712-3p, mmu-miR-511-5p and mmu-miR-217-5p. A, B, and C represent ROC curves of the three miRNAs in mice infected with RH strain of T. gondii compared to healthy controls. D, E, and F represent ROC curves of the three miRNAs in mice infected with ME49 strain of T. gondii compared to healthy controls. (A) Plasma mmu-miR-712-3p yielded a ROC curve value of 0.959 (95% Cl, 0.844 to 0.996), sensitivity of 85%, and specificity of 100%. (B) Plasma mmu-miR-511-5p yielded a ROC curve value of 0.995 (95% Cl, 0.902 to 1.000), sensitivity of 95%, and specificity of 100%. (C) Plasma mmu-miR-217-5p yielded a ROC curve value of 0.940 (95% Cl, 0.817 to 0.990), sensitivity of 100%, and specificity of 85%. (D) Plasma mmu-miR-712-3p yielded a ROC curve value of 0.935 (95% Cl, 0.810 to 0.988), sensitivity of 85%, and specificity of 100%. (E) Plasma mmu-miR-511-5p yielded a ROC curve value of 0.995 (95% Cl, 0.902 to 1.000), sensitivity of 95%, and specificity of 100%. (F) Plasma mmu-miR-217-5p yielded a ROC curve value of 0.910 (95% Cl, 0.776 to 0.977), sensitivity of 80%, and specificity of 95%.
