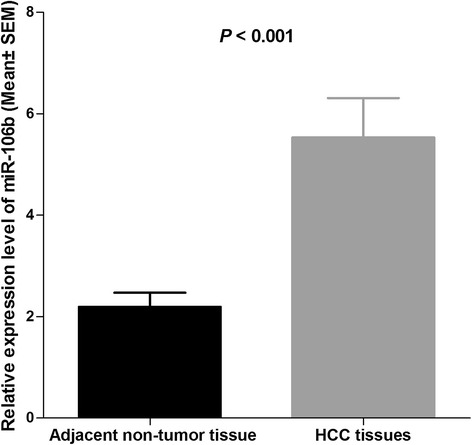
Figure 1.

Comparison of miR-106b expression levels between HCC tissues and adjacent non-tumor tissues. Analysis using the Student’s t-test showed that the relative expression levels of miR-106b in the HCC tissues were significantly higher than those in adjacent non-tumor tissues (P < 0.001). qRT-PCR data are ratios to average of non-tumor tissues.
