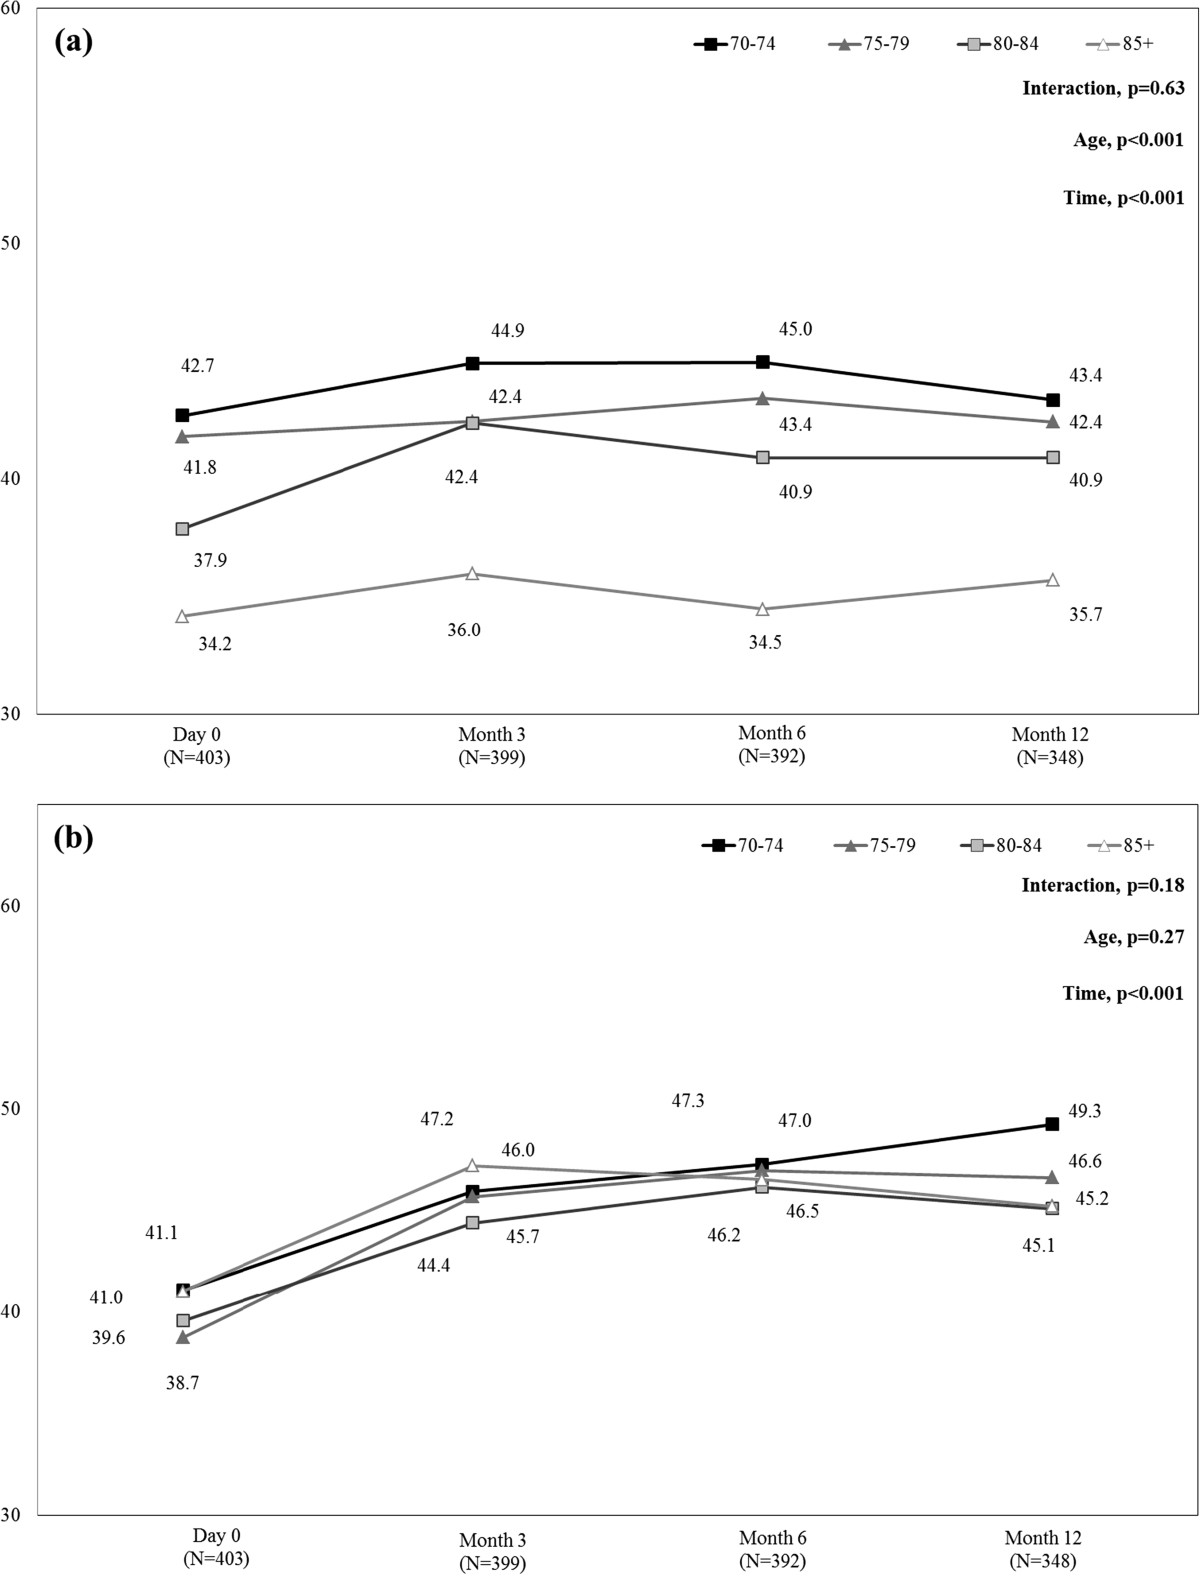
Figure 3.

Mean SF-12 PCS (a) and MCS (b) scores during the 12-month follow-up period by age-group. MCS = Mental Component Summary; PCS = Physical Component Summary; SF-12 = 12-item Short-Form health survey. SF-12 MCS or PCS score <50 indicates quality of life impairment [mean (standard deviation) score in the general 1998 U.S. population was 50 (10)] [12]. Mean MCS and PCS scores were calculated in the whole population of patients aged 70 years or more with available data at each time-point. Missing data were not replaced.
