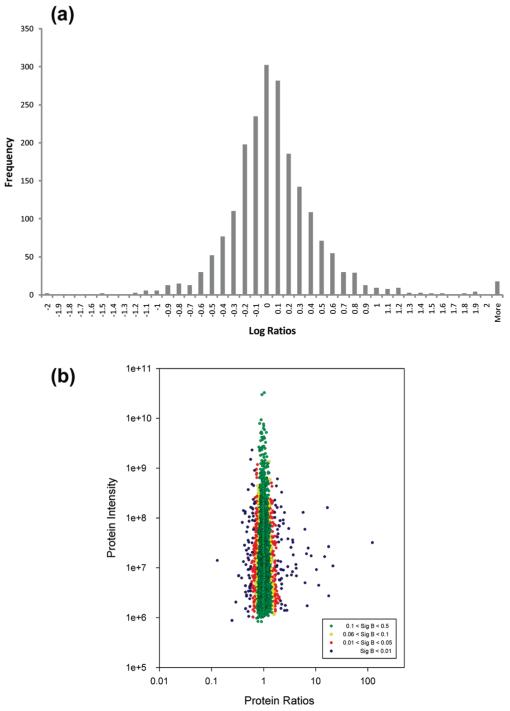
Figure 3.
Overview of the distribution of abundances for the entire SILAC data set. (a) The spread of normalized (log) protein abundance ratios expressed as a histogram follows a normal distribution. (b) Normalized protein abundance ratios plotted against protein intensity. Individual proteins are colored by their Significance B (Sig B) value. Green: proteins with no detected change in abundance (1,601 proteins; Sig B) 0.1–0.5). Yellow: proteins with small, nonsignificant changes in abundance (129 proteins; Sig B) 0.06–0.1). Red: proteins with moderately significant abundance changes (181 proteins; Sig B) 0.01–0.05). Blue: proteins with highly significant abundance changes (134 proteins; Sig B < 0.01).

