Figure 4.

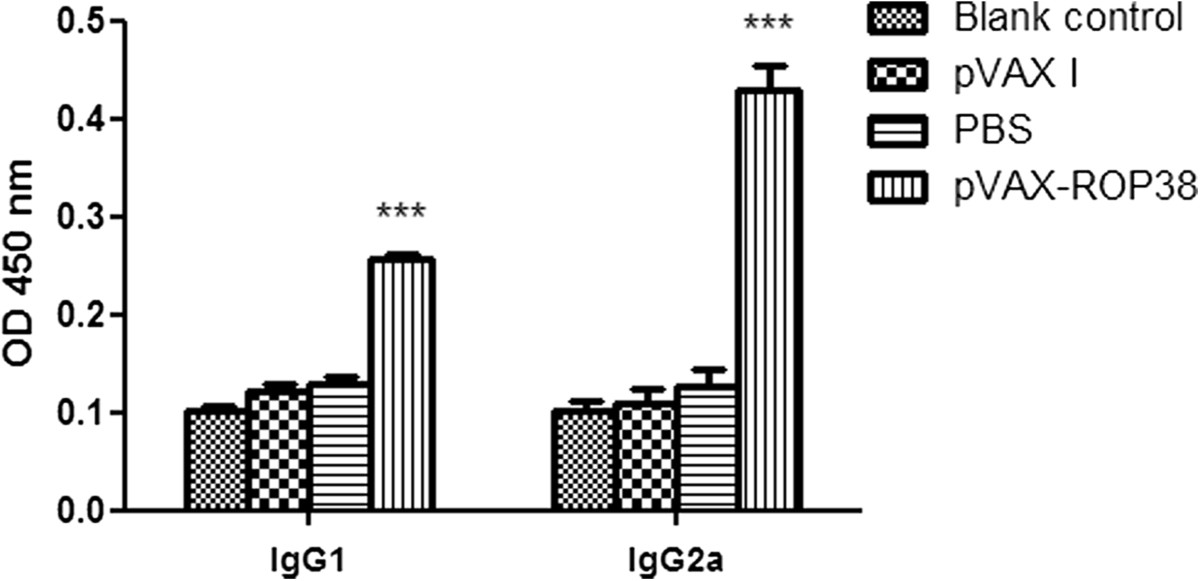
Specific IgG1 and IgG2a pattern upon immunization with pVAX-ROP38. Data are presented as the mean ± SD (n = 3). *** represents highly significantly differences (P < 0.01) compared with the control groups.

Specific IgG1 and IgG2a pattern upon immunization with pVAX-ROP38. Data are presented as the mean ± SD (n = 3). *** represents highly significantly differences (P < 0.01) compared with the control groups.