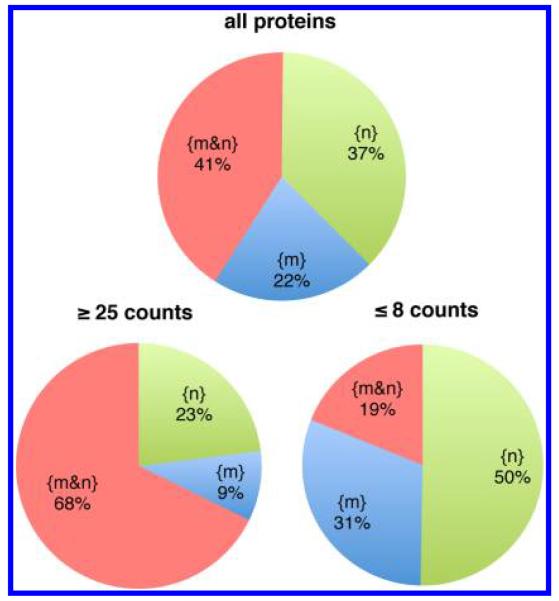
Figure 1.
Partitioning of the sets of proteins detected in the nuclear fraction {N} (1880 proteins) and in the mitochondrial fraction {M} (1502 proteins) between sets of proteins detected only in the nucleus {n}, only in mitochondria {m} or in both organelles {m&n}. (Top) All proteins. (Lower left) High abundance proteins with ≥25 counts in {M}, in {N} or in both. (Lower right) Lower abundance proteins with ≤8 counts in {M}, in {N} or in both.

