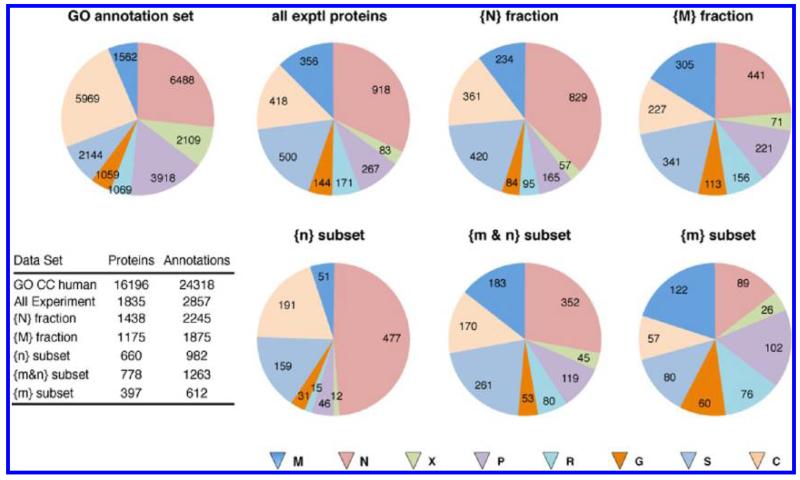
Figure 4.
Enumeration of the GO cell component annotations for the different sets of proteins. The numbers of proteins with the indicated annotation are given on the pie slices. The pie slices are sized as a proportion of all annotations in each data set. Total numbers of proteins and annotations for each data set are given in the inset table. Multiple annotations to the same location were counted only once.

