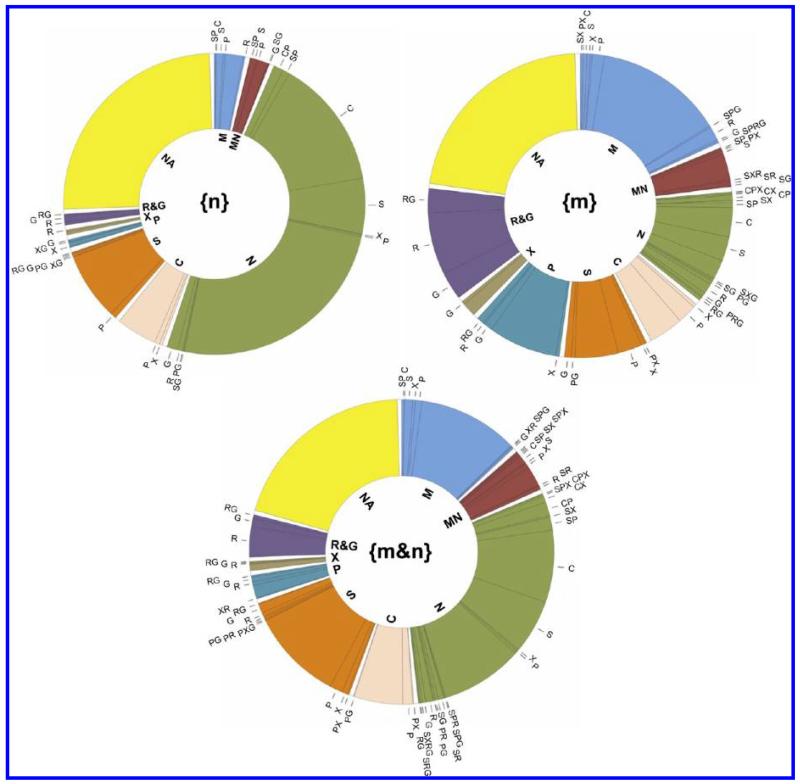
Figure 5.
Hierarchical distribution of GO CC annotation data for the proteins detected only in mitochondria {m} (517 proteins), only in the nucleus {n} (895 proteins) or in both {m&n} (985 proteins) using the hierarchical classification described in the text. The color code corresponds to the hierarchy level given in the center of the doughnut. The annotation terms are: M, mitochondria; MN, mitochondria and nucleus; N, nucleus; C, cytoplasm; S, cytosol; P, plasma membrane; X, extracellular region; R&G, endoplasmic reticulum and/or Golgi apparatus; NA, no annotation.

