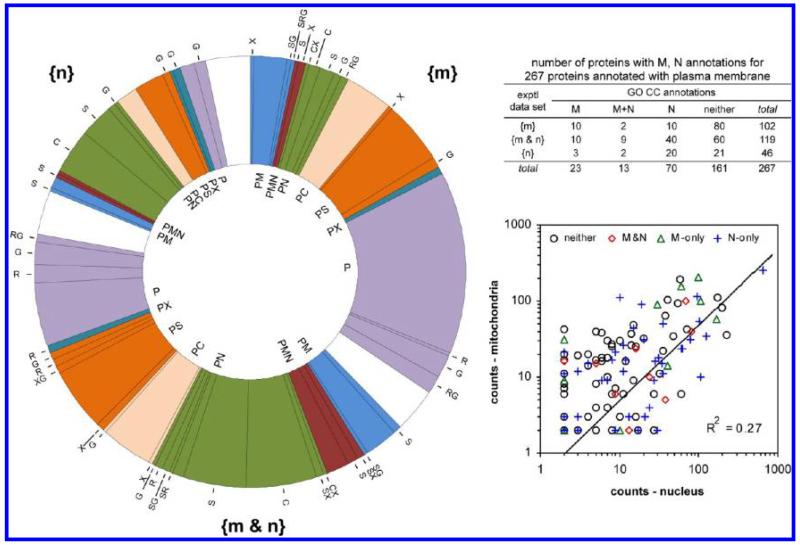
Figure 6.
Evaluation of possible contamination of the nuclear and mitochondrial sucrose gradient fractions by plasma membrane. (Left) Hierarchical distribution of the GO CC annotations for the experimental subsets {m}, {n} and {m&n} for 267 proteins annotated to plasma membrane. The color code corresponds to the upper level annotations shown inside the doughnut. (Inset table) Distribution of the GO CC M and N annotations over the experimental subsets {m}, {n} and {m&n}. (Right) For the 119 proteins in the {m&n} experimental data subset, the correlation between the number of counts in the {M} and {N} gradient fractions. The GO CC annotation for each protein is indicated by M (only), N (only), M+N, or neither. The correlation coefficient R2 was calculated with linear data for all 119 proteins. The data are shown on a log scale to disperse the points.

