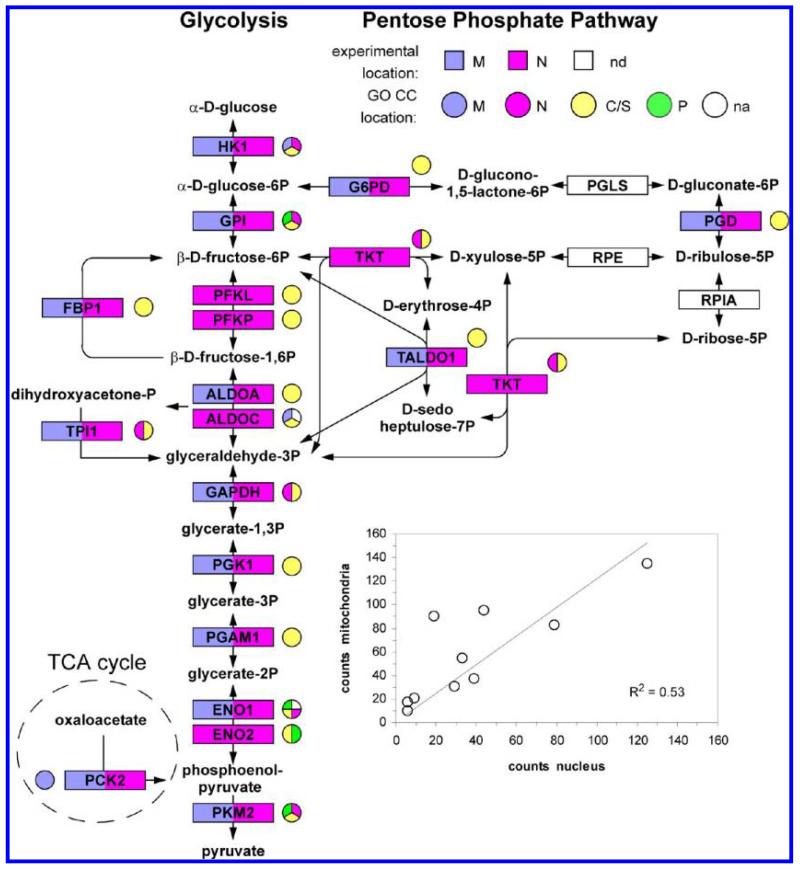
Figure 8.
Summary of the experimental data and GO CC annotation terms for glycolysis and pentose phosphate pathway proteins. nd denotes proteins that were not detected by MS. na denotes proteins for which there was no GO CC annotation for the protein sequence group detected in the MS experiments. In some cases other protein sequences from the same gene that were excluded by the MS data had GO CC annotation, which is shown on the figure. (Inset) Correlation between the number of counts in the nucleus and counts in mitochondria for the ten glycolysis enzymes detected in both locations.

