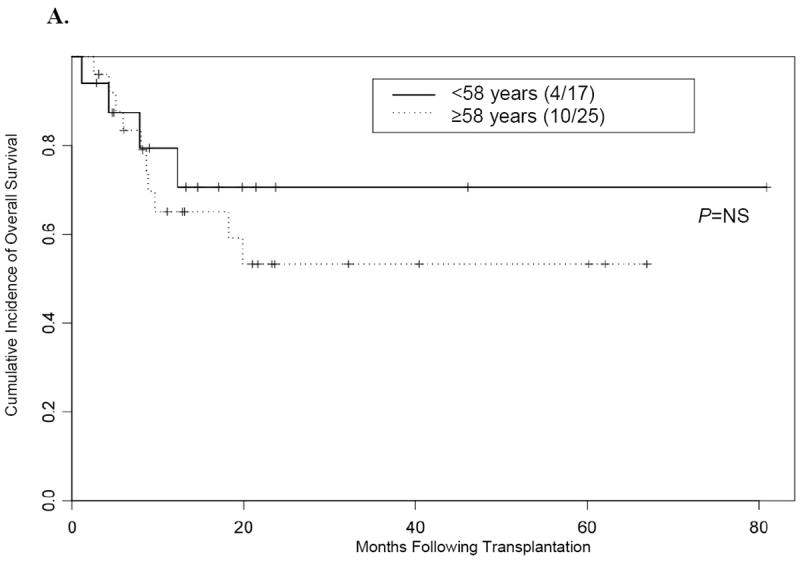
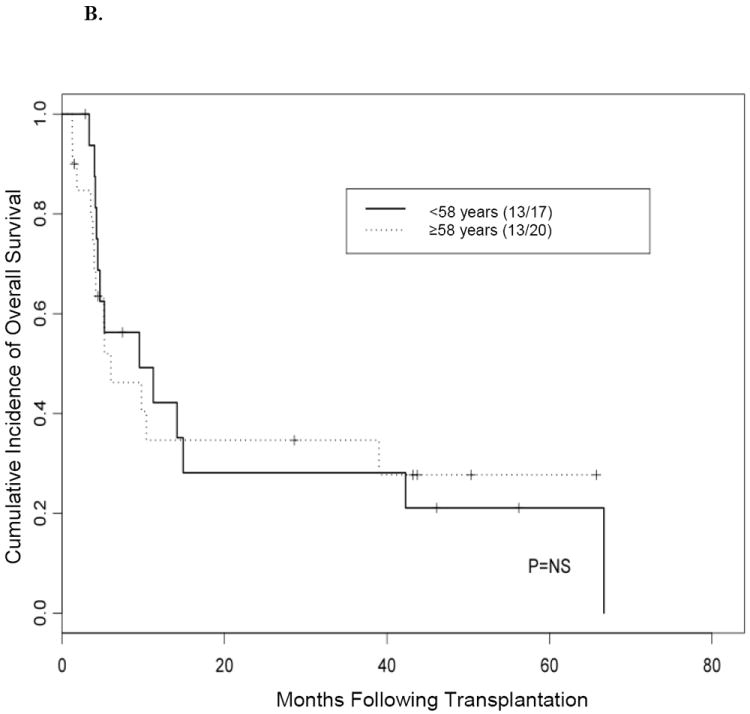
Figure 4. Kaplan-Meier curve for overall survival according to remission status at time of transplantation.


(A) Overall survival in patients 58 years or older versus patients younger than 58 years who underwent transplantation while their disease was in complete remission. (B) Overall survival in patients 58 years or older versus patients younger than 58 years who underwent transplantation while they had active disease.
NS indicates not significant.
