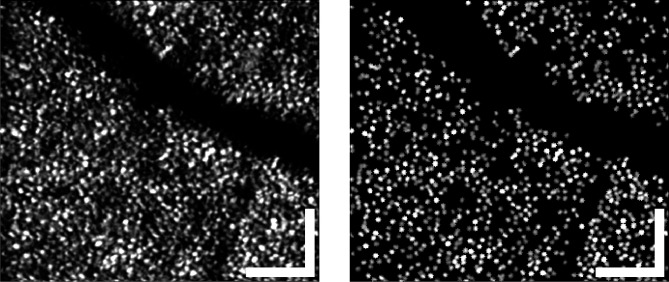
Figure 3.
Typical areal projection of band 2, from S3 at 5°, the same portion of retina shown in Figure 4. The full mosaic is shown on the left, and the cones automatically identified and segmented for analysis on the right. A number of cones were clearly missed by the algorithm, which was intentionally tuned to favor a low false-positive rate over a low miss rate. In spite of the misses, more than a thousand cones were found, on average, in a volumetric image. Scale bars: 50 μm.

