Figure 4.

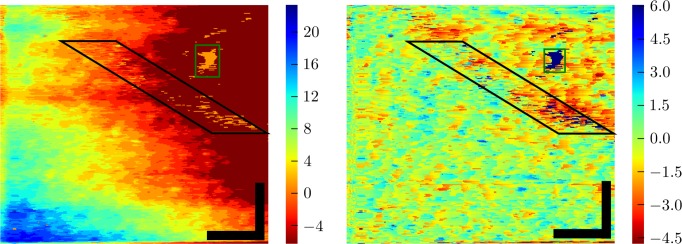
Topography (in μm) of band 2, from S3 at 5°, the same portion of retina shown in Figures 3 and 5. Our custom model-based classification algorithm located the depth of band 2 in the retina automatically (see Appendix). The resulting topography (left) revealed a wide spectrum of height variation. Low frequency variation was due to gross curvature of the retina and axial eye movements. High frequency variation was due to axial displacements among neighboring cone cells, which are more evident after high-pass filtering the topographic image (right). The boxes denote areas with numerous segmentation errors. Those in the black box fall under an intervening blood vessel (visible in Fig. 3), and result from the relatively low reflectance of the underlying cones. Those in the green box are due to a 20-μm region in which cone visibility is poor for an unknown reason (also visible in Fig. 3). Roughness of the high-pass filtered surface was quantified by computing the depth variance along fast scans in the corrected image and taking the square root of the average of those variances. The resulting roughness was 1.6 ± 0.3 μm. Scale bars: 50 μm.
