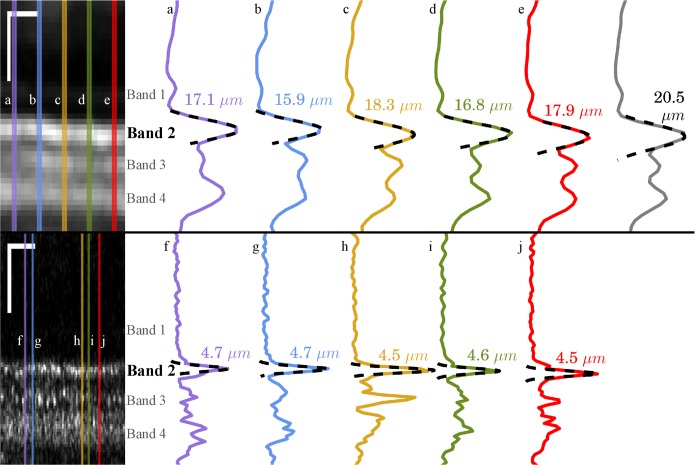
Figure 5.
Band thickness measured with Spectralis OCT and AO-OCT. A 210-μm wide section of a Spectralis B-scan (top left), acquired from S3 at 5.0° and converted to linear intensity scale. The Spectralis instrument permits saving of log-intensity data only; in order to convert to a linear scale, the system's reported dynamic range (43 dB) was used. The overlaid lines indicate the locations of the five A-scans plotted at (top right), labeled a-e. The sixth (gray) plot represents the average of 10 A-scans (56 μm), equal to the size of regions analyzed by other investigators.27 Overlaid on each plot is a least-squares Gaussian fit (dashed line), from which the FWHM of the peak can be readily calculated, indicated for each plotted A-scan. A comparable AO-OCT B-scan (bottom left) from the same subject and eccentricity, also shown in linear scale. Locations for the plotted A-scans (bottom right), labeled f-j, were selected by identifying bright cones in the image. Full-width half maximum values, calculated the same way, were considerably smaller. Note that in both OCT and AO-OCT, averaging over multiple cells leads to an overestimate of layer thickness, due to axial displacements of the reflections. Scale bars: 50 μm.

