
Figure 9.

Distributions of
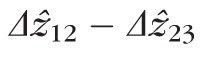 at 2.0° (left) and 5.0° (right), for all four subjects. At both eccentricities
 for most cones, with average differentials of + 2.5 and + 3.3 μm at 2.0° and 5.0°, respectively. Thus, band 2 lies approximately between band 1 (ELM) and band 3, but slightly closer to the latter.