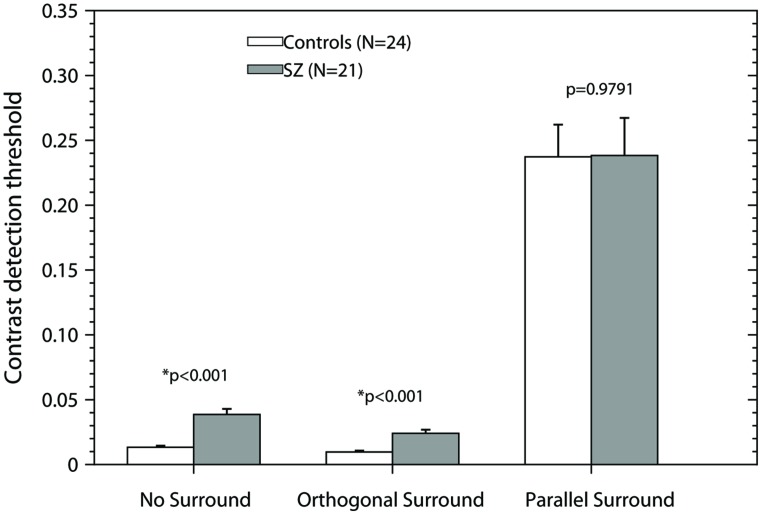
FIGURE 2.
Contrast detection thresholds as a function of the experimental condition. Bars represent the mean + SEM. Gray bars, data of patients; white bars, data of controls. p-values were obtained using the Smith-Welch-Satterthwaite test or unequal variance t-test when Bartlett’s test was significant and a t-test in other case (two-tailed, α = 0.05). Asterisks (*) correspond to significant differences between the means of the contrast detection thresholds.

