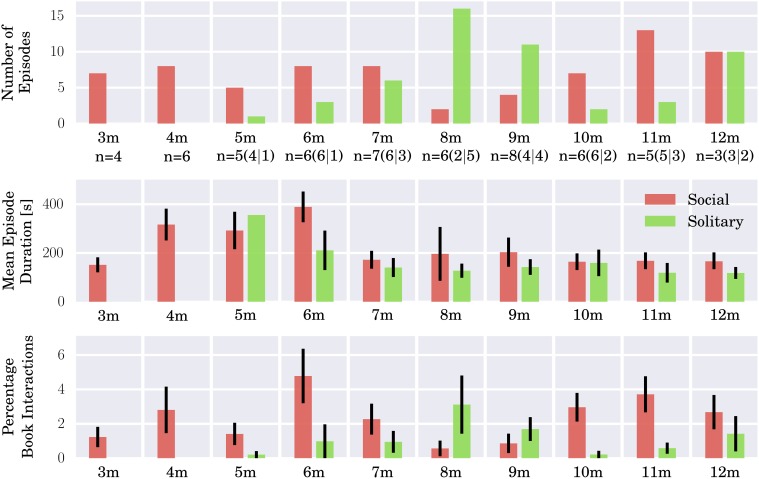
Figure 1.
Social book sharing interactions (red) and solitary book exploration episodes (green) for all infants from 3–12 months. Top: Number of episodes for each month. In addition, the absolute number (“n =”) of individual infants represented in the sample (out of the total of 10) is also given below the bar graph, first in total and then in brackets for social and solitary interactions, respectively, as one infant may engage in multiple episodes in the course of a home visit. Middle: Mean episode durations for each month with standard errors of the mean (SEM). Bottom: Total book interaction time expressed as percentages of the total recorded time infants were awake at each month averaged over all infants. The figure gives an overview of the distributions of the documented book sharing episodes which form the basis of the qualitative study. Note the small sample size.

