
Table 2.
The MMN and P3a mean amplitudes and latencies.
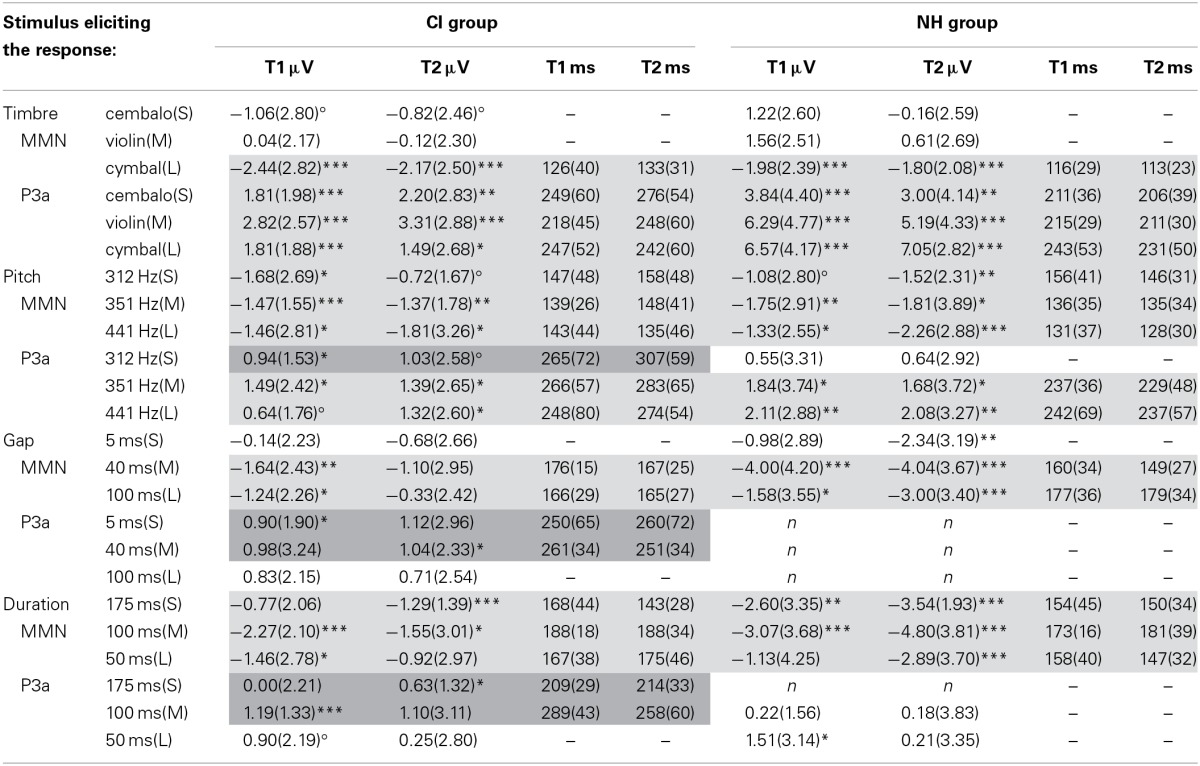
For both CI and NH groups, the mean MMN and P3a amplitude (standard deviation in parenthesis), followed by the significance of the response (°p < 0.1, *p < 0.05, **p ≤ 0.01, ***p < 0.001; two-tailed t-test against zero), are given at T1 and T2. These are followed by the mean of peak latencies (standard deviation in parenthesis). Light gray presents the amplitude and latency values included in statistical comparisons between CI group and NH group as well as between CI singers and CI non-singers. Dark gray presents the values included only in statistical comparisons between CI singers and CI non-singers. – = the individual latencies were not analyzed. n = the responses were non-existent (wrong polarity in the time window of the response). Standard was 295 Hz, 200 ms, 70 db (for CI group)/60 dB (for NH group) piano tone. S, M, L = small, medium and large amount of change.