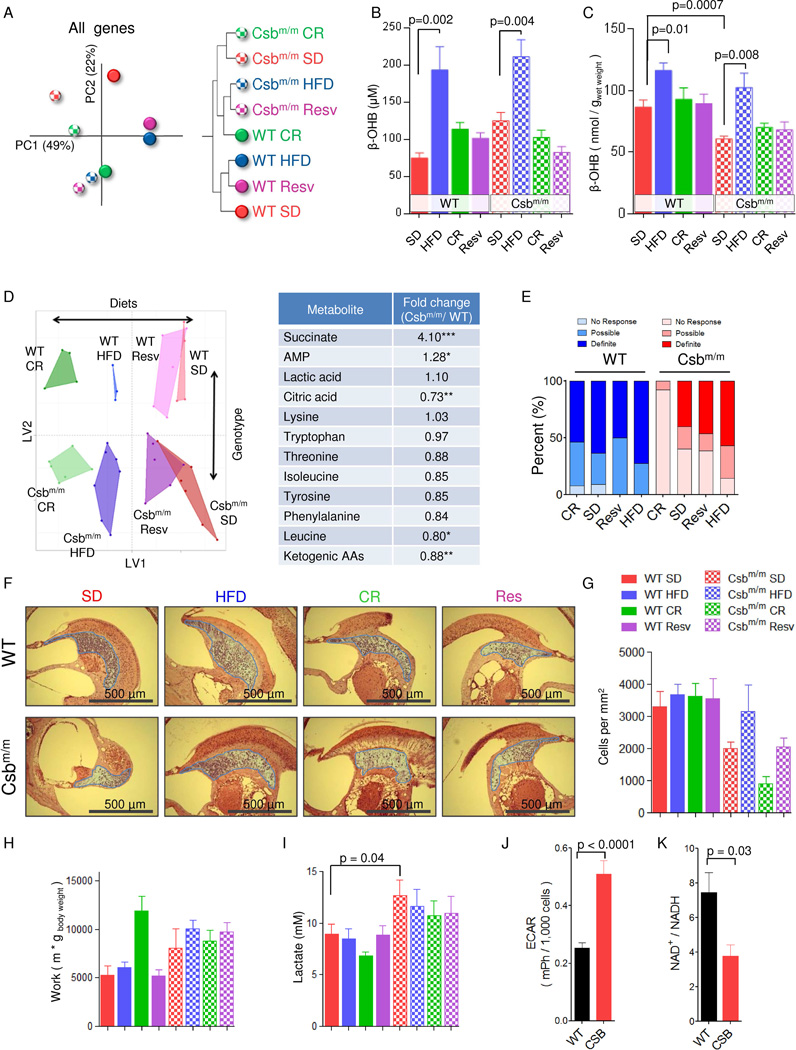
Fig. 2. A high fat diet increases β-hydroxybutyrate levels and rescues the neurological phenotype of Csbm/m mice.
(A) A principal component analysis (PCA) of the unselected average gene expression Z-score from the cerebellum and a hierarchical clustering of the same data (n=3–7). (B) Levels of circulating β-hydroxybutyrate (β-OHB) in the mice (n=6–12, mean ± SEM). (C) Levels of β-OHB in the brain of mice (n=4–9, mean ± SEM). (D) Orthogonal partial least square regression of metabolomics data done on the same samples as in (D) and a list of some altered metabolites when comparing genotype only. (n=3–7). (E) Hearing tests done by exposing the mice to a 108 db recorded clap, videotaping the reaction and subsequently blindly scoring the mice for a reaction to the sound (n=10–14). (F) Representative histological images of hematoxylin and eosin stained sections of the inner ear (blue highlight: spiral ganglion). (G) Quantification of cells in the spiral ganglion (n=3, mean ± SEM). (H) Aerobic capacity of the mice measured by forced treadmill exercise (n=7–11, mean ± SEM). (I) Serum lactate levels (n=7–12, mean ± SEM). (J) Extracellular acidification rates of immortalized CSB patient cells (CS1AN) reconstituted with WT CSB (WT) or an empty vector (CSB) (n=28 separate experiments, mean ± SEM). (K) NAD+/NADH ratio (n=3, mean ± SEM).

