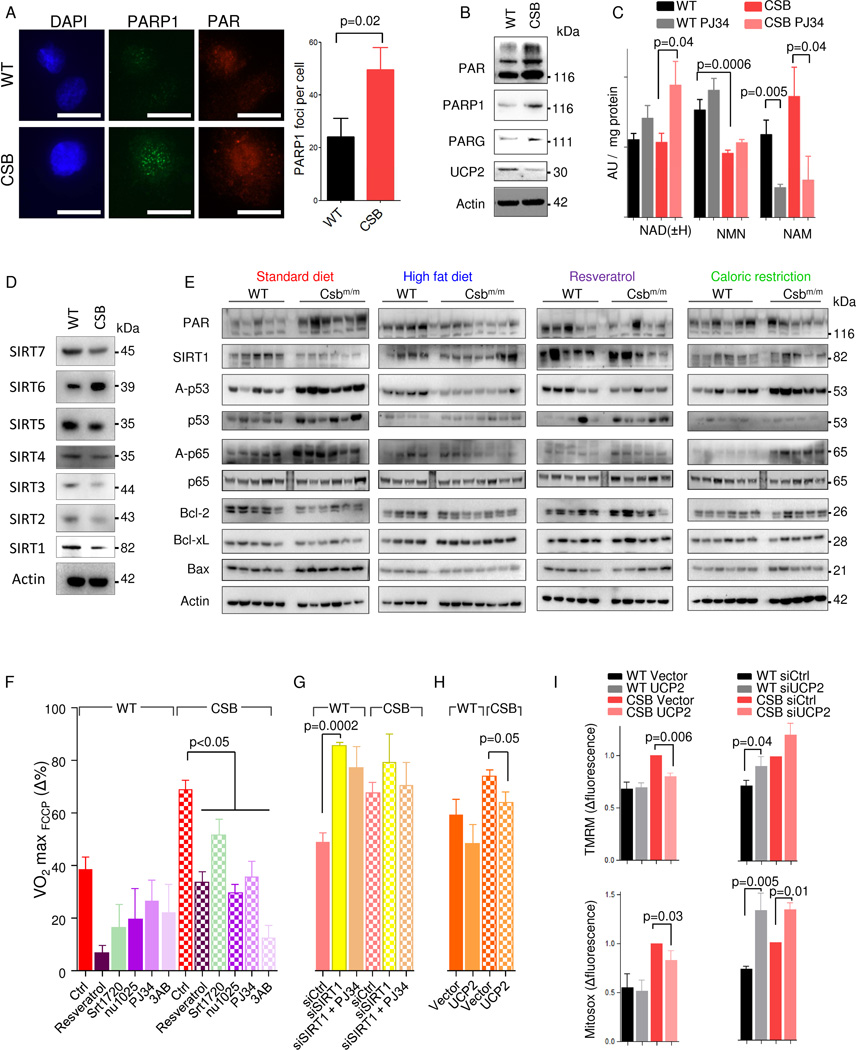
Fig. 3. PARP1 activation drives SIRT1 depression and the mitochondrial phenotype in CSB deficient cells.
(A) Representative confocal microscopy images and quantification of WT and CSB deficient cells stained for PARP1 and PAR (n=3, mean ± SEM). (B) Representative immunoblot of PAR, PARP1, PARG1 and UCP2 in WT and CSB deficient cells (n=3, mean ± SEM). (C) Mass spectrometry of nicotinamide adenine dinucleotide (NAD) and NAD-metabolites in WT and CSB deficient cells; NMN: Nicotinamide mononucleotide; NAM: Nicotinamide; (n=6–8, mean ± SEM). (D) Representative immunoblot of sirtuin levels in WT and CSB deficient cells. (E) Immunoblot of protein levels from the cerebellum of WT and Csbm/m mice on various diets. Each lane is a separate mouse. (F) FCCP uncoupled respiration normalized to basal respiration under various 24 hour treatments (n=3–28 separate seahorse experiments, mean ± SEM). (G) FCCP uncoupled respiration normalized to basal respiration 72 hours after SIRT1 siRNA treatment (n=3, mean ± SEM). (H) FCCP uncoupled respiration normalized to basal respiration 72 hours after UCP2 overexpression (n=3, mean ± SEM). (I) Flow cytometry of WT and CSB deficient cells after overexpression of UCP2 and stained with tetramethylrhodamine methyl ester (TMRM) for membrane potential and mitosox for mitochondrial superoxide production (n=3, mean ± SEM).

