
Figure 2.
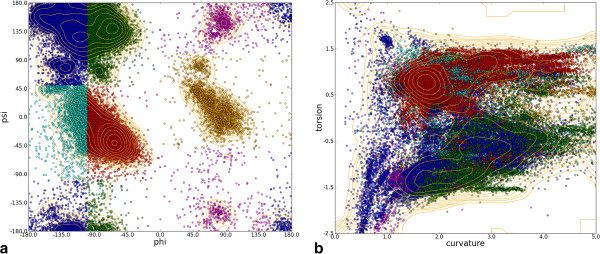
The Ramachandran plot compared to the plot of residue curvature against torsion. (a) Ramachandran plot for all residues in all chains. Colours delineate the regions specified in [65](b) Plot of curvature against torsion for each residue in all chains. Colours denote the region the Ramachandran plot shown in (a). Contour levels are at Fibonacci numbers due to the large number of overlapping points.