
Figure 6.
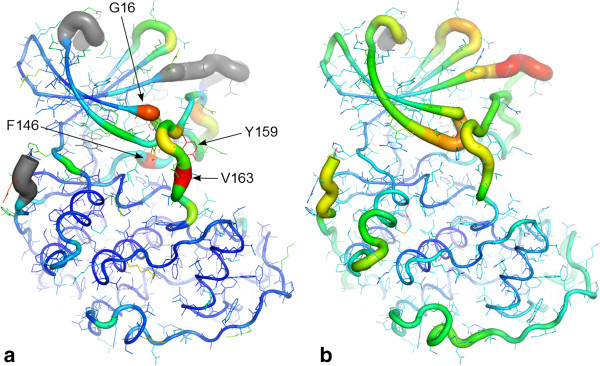
Conformational variability vs. average temperature factor. PyMol putty cartoon of 3PXZ [68] chain A showing summaries over 290 CDK2 chains of (a) relative variability in conformation of backbone κ/τ (tubes) and sidechains (sticks): a grey colour indicates disordered residues in greater than 50% of structures, and (b) average Cα temperature factor (tubes). A red colour and thick tube indicates the highest variability and highest average temperature factor. The labels highlight particularly conformationally variable residues.