
Figure 6.
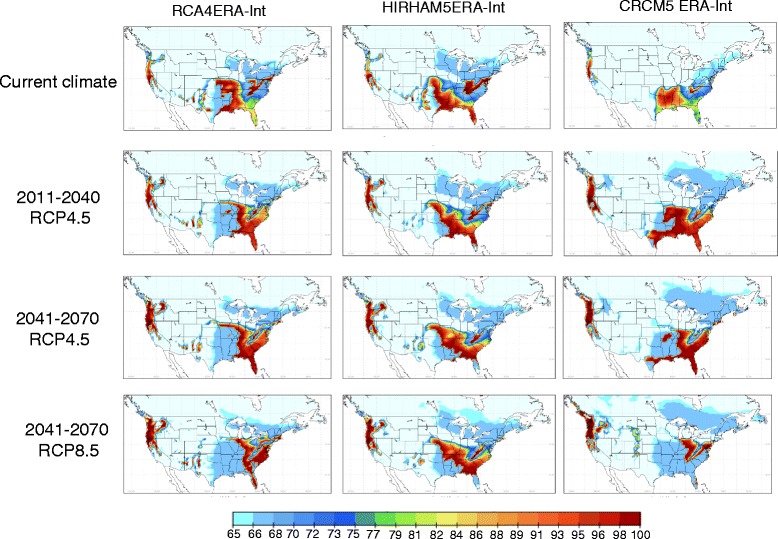
Variation in climate model output. An illustration of variation in current (1981–2010) and future (2011–2040 and 2041–2070) projected climatic suitability (using SIG) for Ae. albopictus using output from three climate models (from left to right hand columns: RCA4, HIRHAM5 and CRCM5). Projections for the time period 2041–2070 using emissions under both RCP4.5 and RCP8.5 are shown. The colour scale below each map shows the value SIG with the cut off at 66.69% and 64.64% indicated by arrows.