
Figure 6.
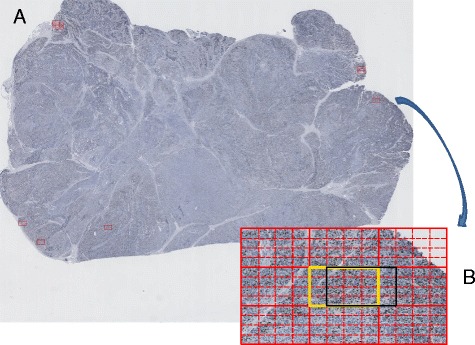
Hotspot Reporting. (A) The original image input for ASH analysis is overlaid with the hotspots (red rectangles). (B) The inset image shows the output from the adaptive step finding algorithm and the black box is the part that is displayed on the main image in (A) as a red rectangle.