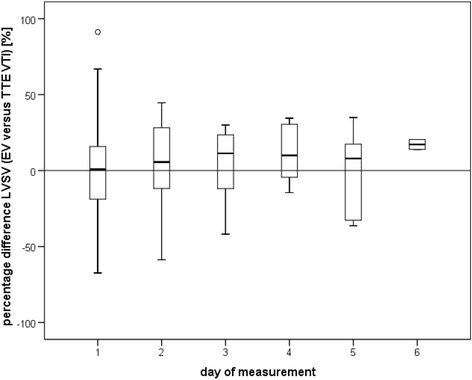
Figure 3.

Trend of left ventricular stroke volume measurements using electrical velocimetry versus measurements based on the velocity time integral over the aortic valve. Percentage difference in repeated left ventricular stroke volume (LVSV) measurements between methods in individual patients on serial measurement days. Box plots show the median, standard deviation, and outliers (136 combined measurement points were included; outliers from Figure 1 were excluded). Note the constant average direction of bias over repeated measurement days. TTE, echocardiography; EV, electrical velocimetry; VTI, velocity time integral.
