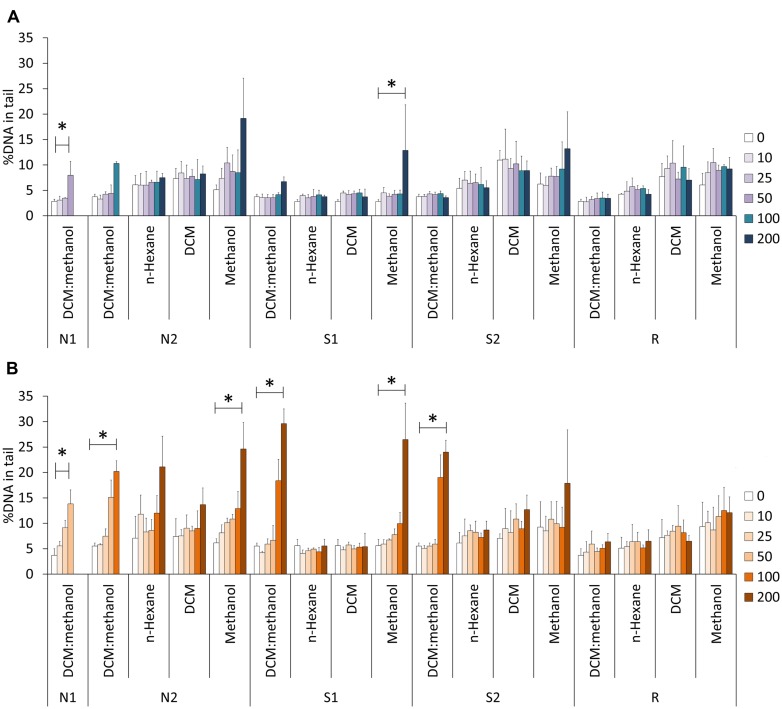
FIGURE 3.
Comet assay results in HepG2 cells exposed to the different sediment extracts at different concentrations (0–200 SEQ mg/mL). (A) Experiments without FPG treatment. (B) Results from the FPG-linked Comet assay. *Indicates significant differences between multiple concentrations (Kruskall–Wallis Median Test, p < 0.05). The results are indicated as mean %DNA in tail ± SD. Dada from DCM:methanol extracts were retrieved from Pinto et al. (2014a). The concentration 0 mg SEQ/mL corresponds to the negative (solvent) control (DMSO only).

