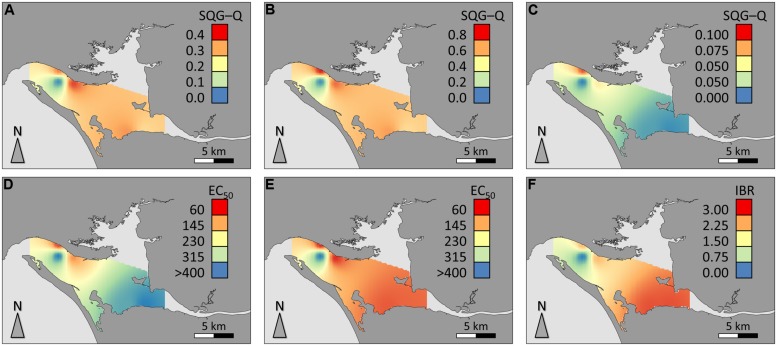
FIGURE 5.
Spatial distribution of data for the study area. (A) SQG-Q for total sediment contaminants (metals plus organic); (B) SQG-Q for sediment metals; (C) SQG-Q for organic sediment contaminants; (D) HepG2 EC50 for DNA strand breakage (crude extract exposure); (E) HepG2 EC50 for oxidative DNA strand breakage (crude extract exposure); (F) IBR for oxidative stress-related biomarkers, all species combined (clam, fish, and cuttlefish). SQG-Qs and IBR are dimensionless. EC50 estimates are expressed as mg SEQ/mL.

