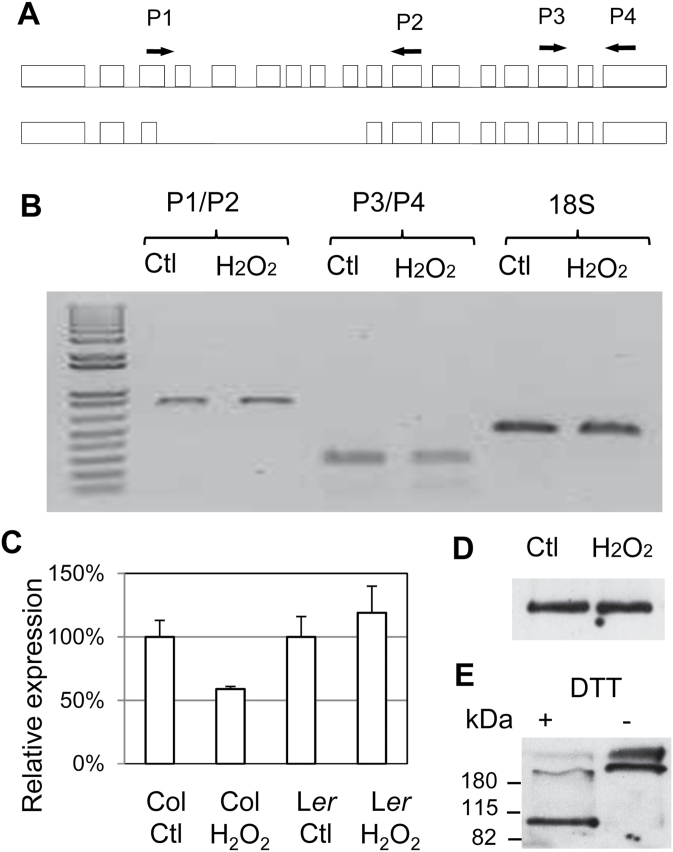
Figure 6.
Effects on ROS on SPY Transcription, Alternative Splicing, and Protein Oxidization.
(A) Diagram of alternative splicing of the SPY transcript, and the position of PCR primers for detection of the two isoforms.
(B) RT–PCR assay of SPY transcript isoforms in the absence (Ctl) or presence of 1mM H2O2. The 18S rDNA was used as an internal control. The change is significant for Col (p < 0.05, t-test) but not for Ler.
(C) Relative SPY transcript level in Col and Ler roots before and after treatment with water or 1mM H2O2 for 24h, as determined by real-time RT–PCR. The error bars represent standard deviations from triplicate measurements.
(D) SPY–GFP protein level in roots after 24h of treatment with water and 1mM H2O2. Equal amounts of total protein extracts were loaded.
(E) Western blot assay of the SPY–GFP protein in the presence (+) or absence of the reducing reagent dithiothreitol (DTT). The numbers on the left are the sizes of protein ladders.

