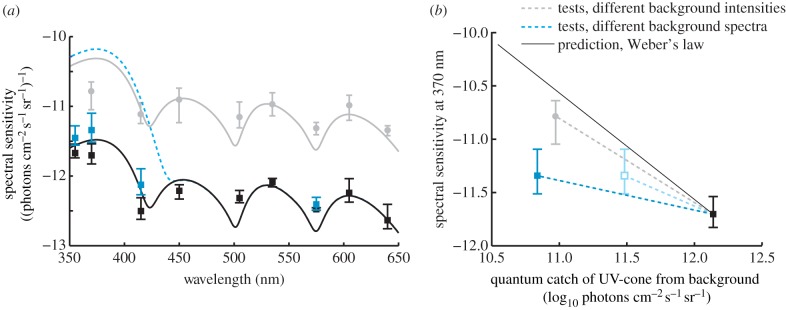
Figure 2.

(a) Measured average spectral sensitivity of all budgerigars. Lines indicate model predictions and data points indicate measured sensitivity for different backgrounds; black squares: UV-rich bright light; grey squares and dashed line (blue online): UV-poor bright light; grey circles: UV-rich dim light (4.3 cd m−2, data from [8]). (b) Spectral sensitivity at 370 nm as a function of the quantum catch of the UV-cone. Weber's law predicts a linear relationship with a slope of −1, but we find shallower slopes for the measured data. The light grey open square (light blue online) indicates the relative shift in estimated quantum catch that results from the alternative approach of modelling a 5 nm red-shifted visual pigment using the Lamb-template (see §4). Error bars indicate minimal and maximal individual spectral sensitivity (averages in figure 1). (Online version in colour.)
