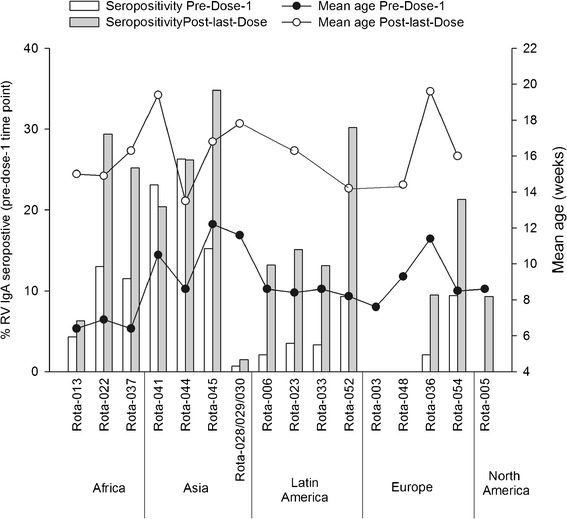
Figure 1.

Age and seropositivity rates at pre-dose-1 time point in the placebo groups (of the Total vaccinated cohort). Numbers on top of the bars indicate mean age in weeks with standard deviation at pre-dose-1 time point.

Age and seropositivity rates at pre-dose-1 time point in the placebo groups (of the Total vaccinated cohort). Numbers on top of the bars indicate mean age in weeks with standard deviation at pre-dose-1 time point.