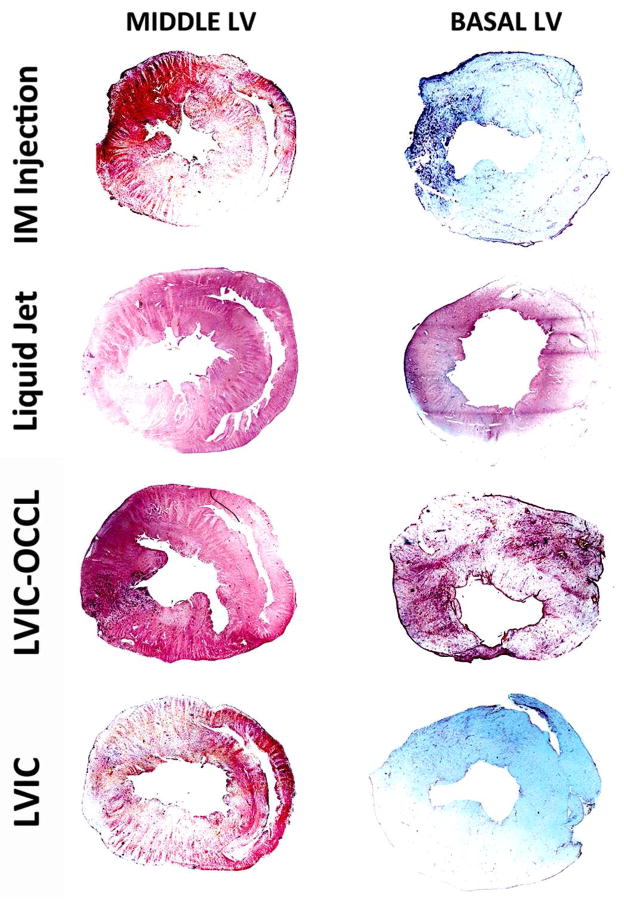
Figure 4.
Left Ventricular Cross Section GFP Expression Distribution Per Delivery Method [4x magnification]. Top to Bottom, IM Injection, Liquid Jet, LVIC-OCCL and LVIC AAV groups. Immunohistochemistry revels EGFP (purple-brown) detection while (white-blue) regions are void. EGFP Expression profiles presented in the Middle and Basal LV sections (left to right) per group with 2D myocardial area coverage expressed as a %.

