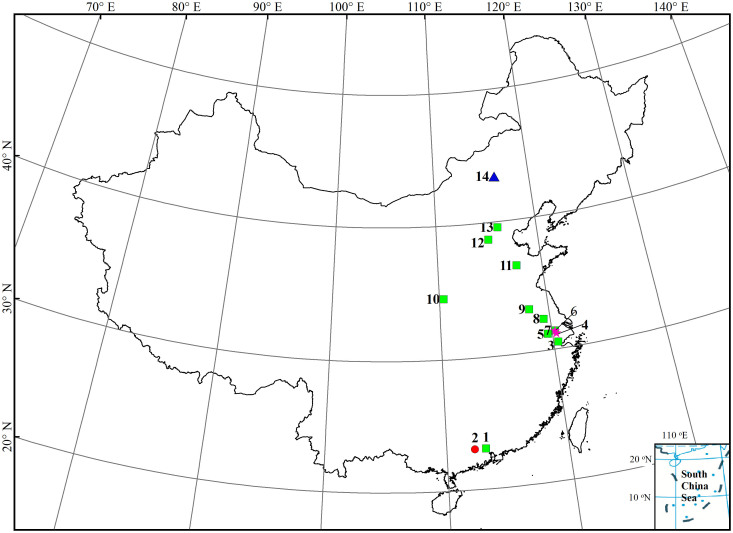
Figure 1. Schematic map showing the 14 locations which included 130 sampling sites for NO emissions.
1, Suburban of Guangzhou, Guangdong province (Li & Wang, 2007); 2, Dinghu Shan, Guangdong province (Li et al., 2007); 3, Shuangqiao Farm, Zhejiang province (Fang & Mu, 2006, 2007, 2009; Fang et al., 2006; Pang et al., 2009); 4, Suburban of Suzhou city, Jiangsu province (Zheng et al., 2003); 5, Dapu, Jiangsu province (Lan et al., 2013); 6, Wuxi, Jiangsu province (Zhou et al., 2010; Deng et al., 2012); 7, Wuxi, Jiangsu province (Deng et al., 2012); 8, Jiangdu, Jiangsu province (Mei et al., 2009); 9, Lingqiao, Jiangsu province (Lan et al., 2013); 10, Dong Cun Farm, Shanxi province (Liu et al., 2011); 11, Huangtai, Shangdong province (Cui et al., 2012; Yang et al., 2013); 12, Wangdu, Hebei province (Zhang et al., 2011); 13, Suburban of Beijing (Walsh, 2001); 14, Xilin, Inner Mongolia (Holst et al., 2007). The symbols triangle, asterisk, solid cycles and solid squares denote grassland, rice paddy, forest and cropland sites, respectively. The references were presented in Note S1. The map was generated using ArcGIS 9.3 (ESRI, CA).

