
Figure 4. Rescue of Lhx6PLAP/PLAP Cell Fate Phenotypes via Transduction of Lhx6, Lhx8, and Arx.
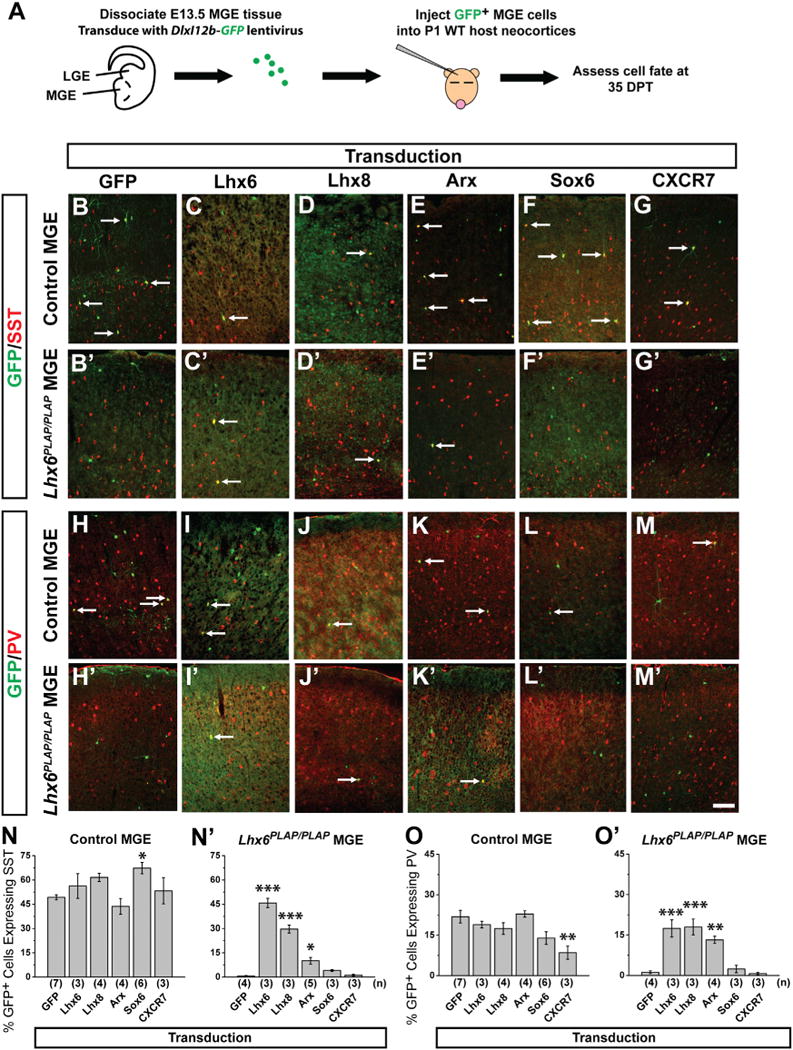
(A) Schema: E13.5 WT and mutant MGE cells are transduced with viruses expressing coding regions for GFP, Lhx6, Lhx8, Arx, Sox6, or CXCR7, and transplanted into P1 WT hosts. GFP+ cells are assessed at 35 DPT for SST or PV expression.
(B–M′) Immunofluorescence showing merged staining of GFP (green) with SST or PV (red) in the neocortex of controls (B–M) and Lhx6PLAP/PLAP (B′–M′). Scale bar in (M′) represents 100 μm.
(N and N′) Proportion of GFP+ cells that express SST for control (N) and Lhx6PLAP/PLAP (N′) transplants.
(O and O′) Proportion of GFP+ cells that express PV for control (O) and Lhx6PLAP/PLAP (O′) transplants. Data are represented as mean ± SEM. One-way ANOVA was used to test significance among the groups: *p < 0.05, **p < 0.01, ***p < 0.001 compared to GFP transduction alone. Arrows point to GFP+ cells that coexpress the indicated marker.
See also Figures S3–S5.