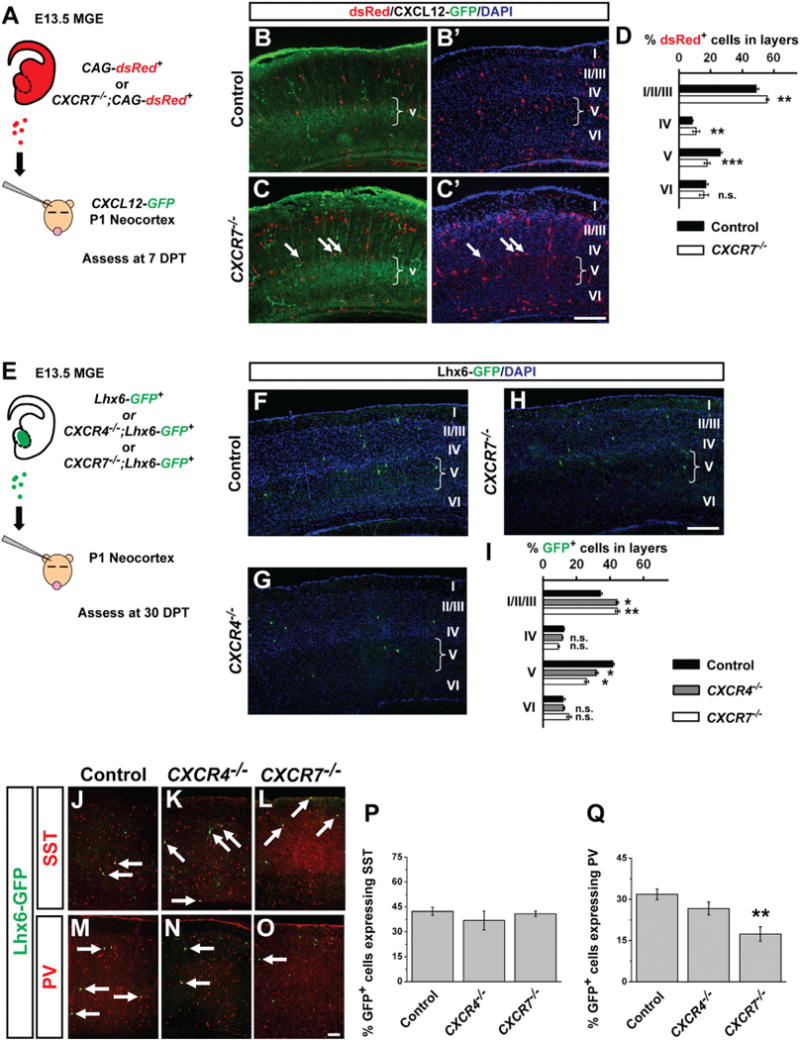
Figure 6. CXCR7 and CXCR4 Regulate Laminar Position of Transplanted MGE Cells.

(A) Schema depicting transplant of E13.5 CAG-dsRed+ MGE cells into P1 CXCL12-GFP reporter hosts.
(B–C′) Immunofluorescent images of transplanted MGE cells in the neocortex at 7 DPT, arrows in (C) and (C′) point to dsRed+ cells at the IV/V border that lie outside of the CXCL12-GFP+ domain in layer V. Brackets show the width of layer V. Scale bar in (C′) represents 250 μm.
(D) Quantification of CAG-dsRed+ cells in neocortical layers at 7 DPT.
(E) Schema depicting transplant of E13.5 Lhx6-GFP+ MGE cells into P1 WT hosts.
(F–H) Lhx6-GFP immunofluorescence (green) merged with DAPI (blue) in neocortex of mice in which either Control, CXCR4−/− or CXCR7−/− E13.5 Lhx6-GFP+ MGE cells were transplanted into P1 WT neocortex and assessed at 30 DPT. Scale bar in (H) represents 250 μm.
(I) Proportion of GFP+ Cells in Neocortical Layers of WT CXCR4−/− and CXCR7−/− MGE Cells
(J–Q) Immunofluorescence of 30 DPT transplants stained for SST (J–L) or PV (M–O), arrows point to coexpressing cells. Quantification of the proportion of Lhx6-GFP+ MGE cells that express SST (P) or PV (Q). Data are represented as mean ± SEM. Chi-square test (for lamination) or one-way ANOVA (for cell fate proportion) was used to test significance between groups. *p < 0.05, **p < 0.01, ***p < 0.001. Scale bar in (O) represents 100 μm.
See also Figure S7.
