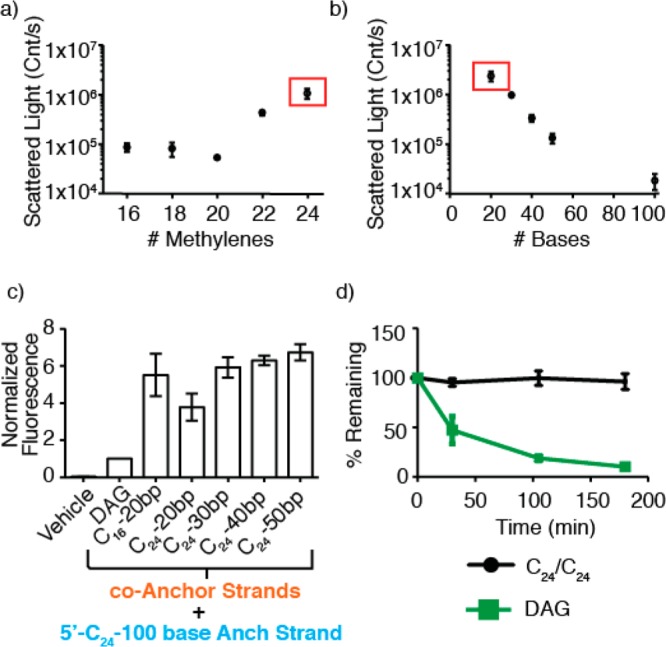
Figure 3.

Ratio of FA to oligonucleotide length determines the extent of aggregation. (a) Light scattering from solutions of 3′-cA20 strands as a function of FA anchor length. (b) Light scattering from solutions of 3′-cA-C24 anchored oligonucleotides as a function of the number of DNA bases. The red box indicates the same strand, 3′-cA20-C24. (c) Membrane incorporation compared to DAG for combinations of 3′-cA-C24 with increasing numbers of DNA bases. (d) Incorporation vs time for DAG and 5′-Anch100-C24/3′-cA50-C24-DNA. Error bars are standard deviation of at least three independent measurements.
