Figure 2.

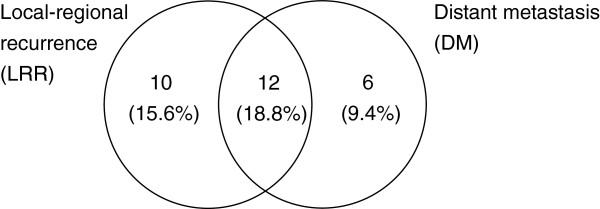
Failure pattern. The numbers in the circles were the patient numbers of relevant failure patterns. The percentage of relevant failure patterns were shown in the parentheses.

Failure pattern. The numbers in the circles were the patient numbers of relevant failure patterns. The percentage of relevant failure patterns were shown in the parentheses.