
Figure 4.
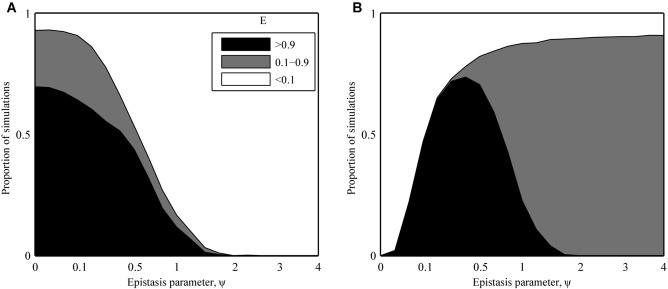
Proportion of stochastic simulations where peak infectivity range (E; eq. 8) was greater than 0.9 (black), less than 0.1 (white), or between these values (gray), for (a) gradual (SYM) and (b) sudden (ASYM) changes in host phenotype. The parameter ψ controls the type and strength of epistasis between infectivity alleles, ranging from strong positive (ψ << 1), through weak positive (ψ < 1), none (ψ = 1), and finally, negative (ψ > 1) epistasis. The patterns in the SYM scenario are broadly similar to those in the deterministic version of the model (Fig.3A), but infectivity range is predicted to peak for weak positive epistasis in the ASYM scenario. This disparity can be explained by the low probability of fixing multiple mutations in the presence of strong positive epistasis.