
Figure 5.
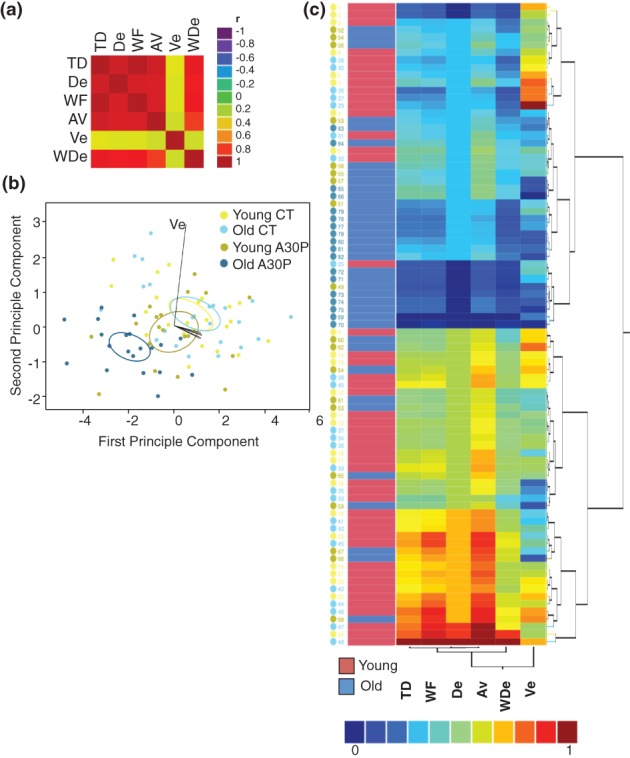
Distinct walking pattern of aged A30P flies. (a) Correlation heat map. Five walking qualities (TD, De, WF, AV and WDe) are highly correlated with each other [the correlation coefficients (Rs) range from 0.79 to 0.99], but not with Ve (Rs range from 0.267 to 0.298). The inputs are data of all flies from Fig. 4. (b) Biplot of a discriminative analysis. Each point is data of one fly. Each linear trajectory represents one variable. Each ellipse corresponds to a 95% confidence limit for a mean. Discriminative analysis was constructed using ‘quadratic method’. A summary of discrimination power was tabulated in Table2. (c) Clusters of fly walking, based on the measurements of TD, MF, De, AV, Ade and Ve, and ages, young or old. For multivariate analysis, all data were scaled linearly between 0 and 1.