
Figure 3.
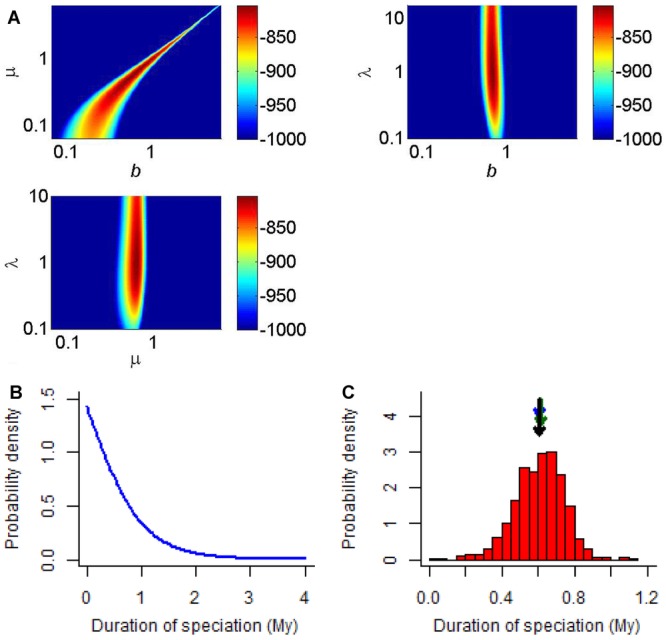
Application of the protracted speciation model to the primate clade. (A) Projections of the log-likelihood surface around the likelihood optimum for the primate clade; the third parameter is always kept at its maximum likelihood (ML) value. All log-likelihood values lower than −1000 are in dark blue (black on black-and-white version). (B) Probability density distribution of the duration of speciation at the ML parameter estimates. This provides insight in the variation across the clade: although the mode predicts that most speciation events will be short, there is a substantial tail of the distribution at long durations. (C) Bootstrap distribution of the duration of speciation for the ML parameter estimates. This provides insight in the bias and uncertainty of the expected duration of speciation: the longest (black) arrow indicates the expected duration at the ML estimates (see also panel A), whereas the medium (green) and shortest (blue) arrows indicate the median and mean of the bootstrap values, respectively.