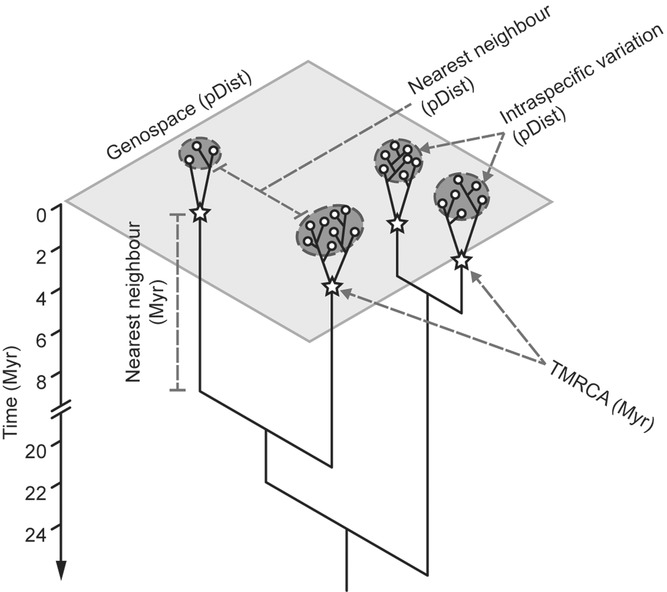
Figure 1.

Schematic representation of genospace and how genetic variation corresponds to gene trees. Intraspecific variation can be measured by genetic distance, as delineated by the dark gray dotted ellipses, or time to the most recent common ancestor (TMRCA), as indicated by the stars. Similarly, interspecific variation can be measured using raw genetic distances or phylogenetic distances (long vertical branches). The size of the dotted circle and branch length is relative to the size of the intra- and interspecific variation, respectively. Here phylogenetic distance corresponds to time (Myr) as the trees are chronograms.
