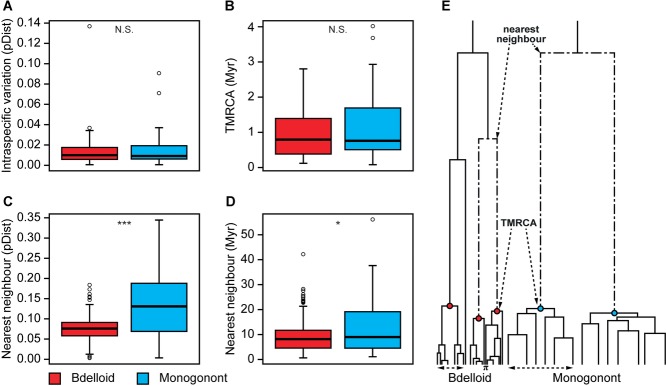
Figure 4.

Box plots representing the discreteness of bdelloid (light gray; red online) and monogonont (dark gray; blue online) rotifer GMYC species in relation to intraspecific genetic distance (π [pDist]; A), time to the most recent common ancestor (TMRCA [Myr]; B), genetic distance to the nearest heterospecific neighbor (pDist; C), and phylogenetic distance to the nearest heterospecific neighbor (Myr; D). (E) Schematic of the typical bdelloid and monogonont gene trees; species are represented by nodes at the point of coalescence. The dashed arrows highlight aspects of the phylogeny used to measure nearest neighbor (D), TMRCA (B), and pi (Π; A). For the box plots, measurements were averaged across bdelloid and monogonont Bayesian datasets. Open circles represent outlier values. The significance of the difference between bdelloid and monogonont datasets for the various measures is shown at the top of each box (N.S. = P > 0.05; *P < 0.05; **P < 0.01; ***P < 0.001).
