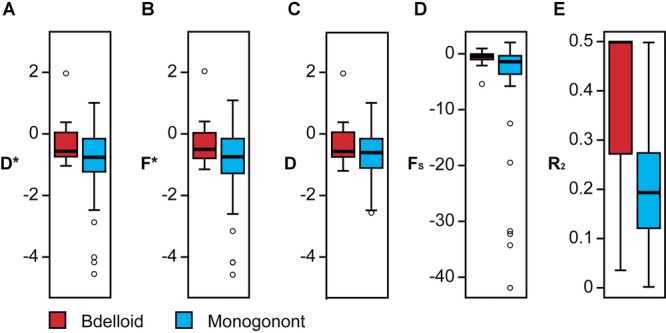
Figure 5.

Box plots showing the distribution of five population genetics signatures across clusters within both bdelloid (light gray; red online) and monogonont (dark gray; blue online) rotifers. Boxes indicate the extent of the first and third quartiles. Whiskers indicate the most extreme datapoints within 1.5 times the interquartile distance from the box and open circles represent outlier values. (A) D*; (B) F*; (C) FS; (D) Tajima's D; (E) R2.
