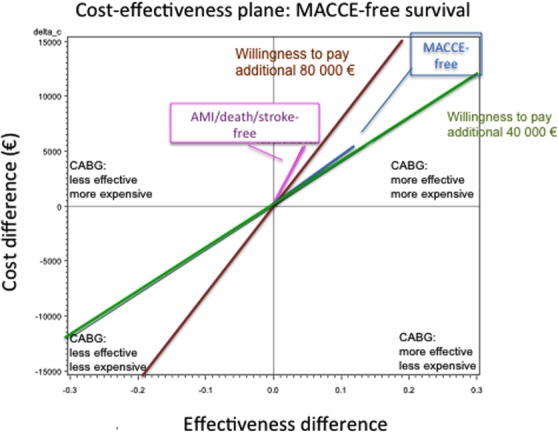
Figure 3.

Cost effectiveness plane and willingness to pay more money for major adverse cardiac and cerebrovascular events (MACCE)-free and acute myocardial infarction (AMI)/death/stroke-free survival. The x- and y-axes are the same as Fig. 2. Two reference lines in the plot represent two different levels of willingness to pay to prevent one event. The amounts of 40,000 and 80,000 € were chosen arbitrarily. [Color figure can be viewed in the online issue, which is available at wileyonlinelibrary.com.]
