
Figure 3.
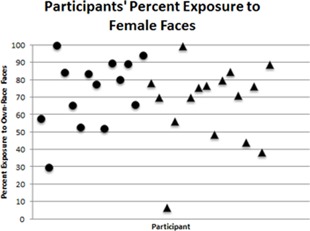
Each participant's percent exposure to female faces. Each point represents one participant. Circles represent 1‐month‐old infant participants and triangles represent 3‐month‐old infant participants. Infants are ordered by age, from youngest to oldest.