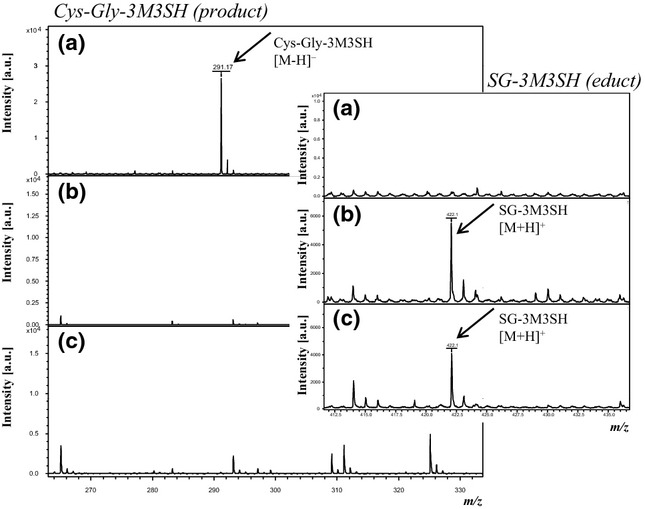
Figure 4.

Mass spectra data showing metabolism of SG-3M3SH by human and bovine γ-glutamyl transferase 1 (GGT1). (a) Sample containing SG-3M3SH and human GGT1 shows Cys-Gly3M3SH formation after reaction time. At the same time, SG-3M3SH is not detectable any more. (b) In the reaction batch containing SG-3M3SH and bovine GGT, generation of Cys-Gly-3M3SH cannot be observed. SG-3M3SH detection is unchanged after the reaction time. (c) In the sample containing SG-3M3SH without enzymes, Cys-Gly-3M3SH cannot be detected whereas SG-3M3SH is still present. Displayed details of the mass spectra are focused on the detection of the specific mass signals for Cys-Gly-3M3SH and SG-3M3H (small boxes included in the respective mass spectra). Cys-Gly-3M3SH (m/z 291.17 [M-H]−) was detected in negative ion mode using DMAN as the matrix. The presence of SG-3M3SH was investigated by applying α-CHCA matrix; hence, achieving detection as [M+H]+ adduct (m/z 422.19).
