
Fig. 3.
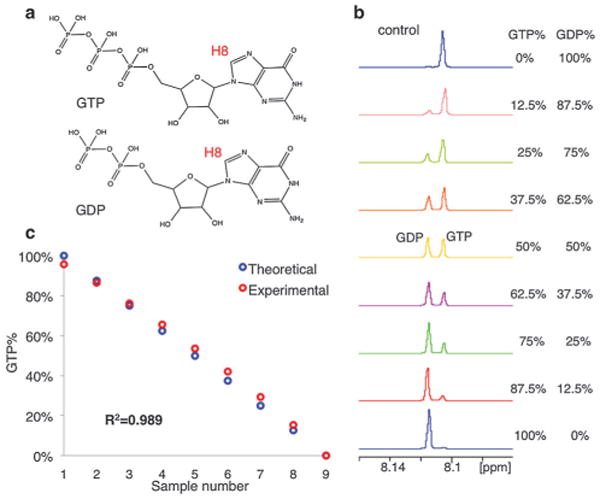
Quantitative measurement of GTP/GDP in control experiment. (a) GTP, GDP structure: the H8 used for quantification is labeled. (b) NMR titration experiment to quantify GTP% in control samples. (c) Data fitting and R2 analysis of control experiment.